
꾸준하고 즐겁게
Time Series 데이터 분석을 위한 Prophet 라이브러리 사용하기 본문
Prophet에 대해서
| 예언자(預言者, 영어: prophet)는 일반적으로 앞일을 미리 말하는 사람이다. 대언자라고도 한다. |
facebook.github.io/prophet/docs/quick_start.html]
Quick Start
Prophet is a forecasting procedure implemented in R and Python. It is fast and provides completely automated forecasts that can be tuned by hand by data scientists and analysts.
facebook.github.io
Prophet 라이브러리는 이름 그대로 Time Series Dataset에 대한 예측을 위해 설계된 오픈 소스 라이브러리이다.
사용하기 쉬우며, 모델에 적합한 하이퍼 파라미터 세트를 자동으로 찾도록 만들어져있다.
코드도 간단하고 성능도 좋다.
타임시리즈 데이터를 분석할 때 굉장히 애용하고 있다.
설치 명령어
| pip install fbprophet |
fbprophet
Automatic Forecasting Procedure
pypi.org
facebook.github.io/prophet/docs/installation.html
Installation
Prophet has two implementations: R and Python.
facebook.github.io
Prophet 라이브러리 사용
Prophet 라이브러리를 사용하기 위해서는, Time series 데이터가 들어간 컬럼이 필요하다.
아래 글을 참조한다.
gradient-descent.tistory.com/17
Pandas의 datetime Index와 resample
데이터셋을 하나 다운로드 받아서 가지고 놀고 있다. 마침 적당하다는 생각이 들어서, pandas의 datetime index와 resample에 대해 알아보려고 한다. Pandas의 to_datetime 함수 사용법 csv 파일을 불러와 EDA 작
gradient-descent.tistory.com
EDA 작업과 데이터 프리프로세싱을 거쳐, 아래와 같은 형태로 만들어준다.
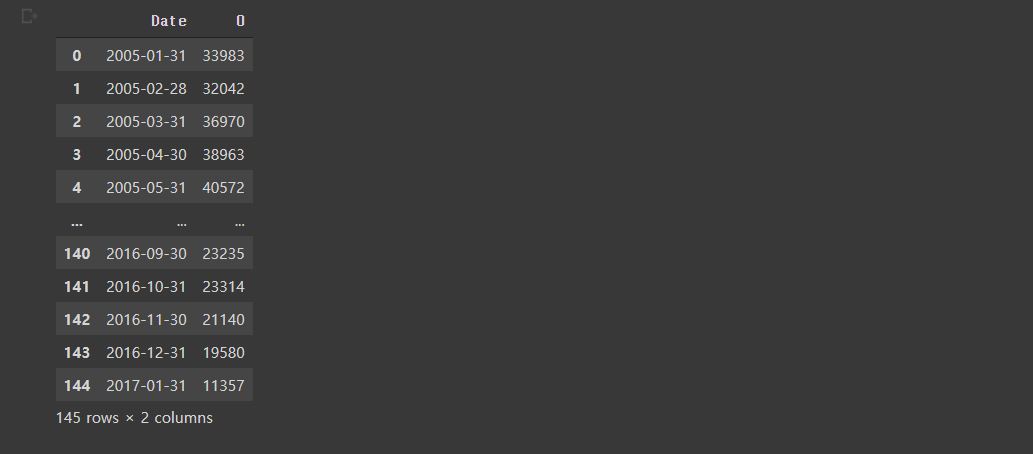
날짜 컬럼과 수치데이터가 있어야 프로펫을 쓸 수 있다.
df.columns = ['ds', 'y']
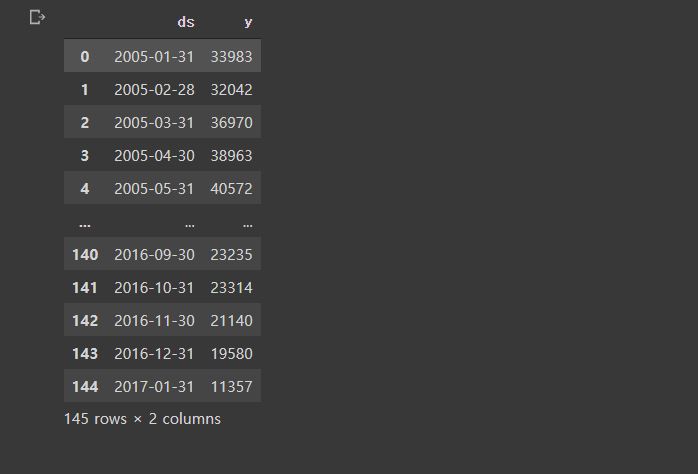
프로펫 라이브러리를 사용하려면 반드시 날짜 컬럼은 'ds' 로, 예측하려는 수치는 'y'로 바꿔야한다.
이제 프로펫으로 예측해보자.
m = Prophet()
m.fit(df)
future = m.make_future_dataframe(periods = 36, freq = 'M')
pandas.pydata.org/pandas-docs/stable/user_guide/timeseries.html#timeseries-offset-aliases
Time series / date functionality — pandas 1.2.4 documentation
To localize these dates to a time zone (assign a particular time zone to a naive date), you can use the tz_localize method or the tz keyword argument in date_range(), Timestamp, or DatetimeIndex. You can either pass pytz or dateutil time zone objects or Ol
pandas.pydata.org
frequency 파라미터는 periods의 단위를 나타낸다.
위의 코드를 사용할 경우, 마지막 데이터의 날짜로부터 36개월까지를 예측하게 된다.

날짜가 3년 늘어난 것을 볼 수 있다.
forecast = m.predict(future)

결과가 한 화면에 다 나오지 않는데,
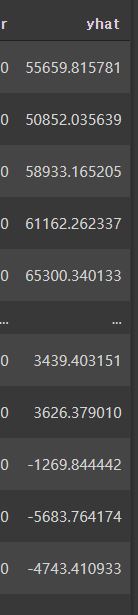
예측값은 yhat 컬럼에 들어있다.
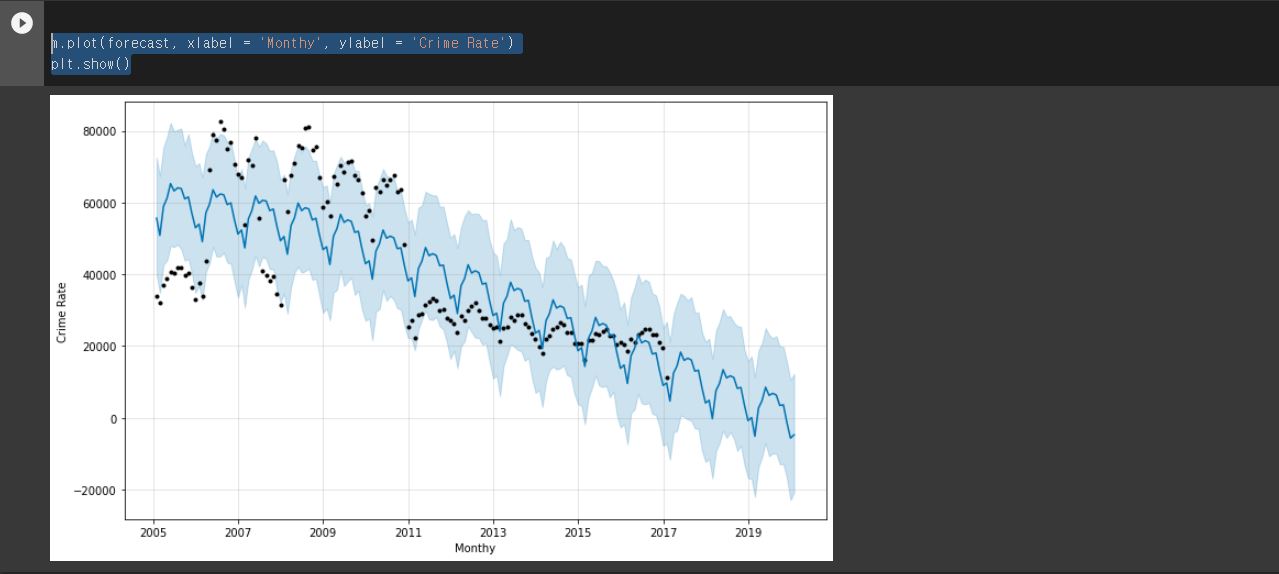
프로펫 라이브러리로 차트도 그릴 수 있다.
파란 음영은 트렌드를 의미하고, 검은 점들은 실제 데이터들이다.
예측 값은 파란색 선으로 표시되고 있다.