꾸준하고 즐겁게
Learning Curve를 통해 Overfitting 확인하기 본문
Overfitting과 Underfitting이란?

먼저 Overfitting과 Underfitting에 대해 간단히 알아본다.
위키피디아에 들어갔는데 이해하기 쉬운 설명이라고 생각되어서 가지고 왔다.
en.wikipedia.org/wiki/Overfitting
Overfitting - Wikipedia
From Wikipedia, the free encyclopedia Jump to navigation Jump to search Analysis that corresponds too closely to a particular set of data and may fail to fit additional data Figure 1. The green line represents an overfitted model and the black line repre
en.wikipedia.org
| Overfitting is "the production of an analysis that corresponds too closely or exactly to a particular set of data, and may therefore fail to fit additional data or predict future observations reliably". |
Overfitting은 "특정 데이터 세트에 너무 가깝거나 정확하게 일치하는 분석의 생성으로, 따라서 추가 데이터에 적합하지 않거나 미래의 관측치를 안정적으로 예측하지 못할 수 있습니다"
Underfitting은 Overfitting의 반대다. 학습이 덜 된 상태인 것이다.
(번역기가 생각하는 것 이상으로 일을 너무 잘한다.)
Learning Curve
모델을 학습시키는 데에 성공했다.
그러면 이 모델이 오버피팅이 된 모델인지, 언더피팅 된 모델인지 어떻게 확인해볼 수 있을까.
그럴 땐 Learning curve를 그려보면 알기 쉽다.
learning curve는 학습하는 데 들어간 시간 대비 성취도를 나타내는 그래프를 말한다.
모델을 history라는 변수에 저장하고, 아래와 같은 함수를 작성한다.
def learning_curve(history, epoch):
  plt.figure(figsize = (10,5))
  epoch_range = np.arange(1, epoch + 1)

  plt.subplot(1, 2, 1)

  plt.plot(epoch_range, history.history['accuracy'])
  plt.plot(epoch_range, history.history['val_accuracy'])
  plt.title('Model Accuracy')
  plt.xlabel('epoch')
  plt.ylabel('Accuracy')
  plt.legend(['Train', 'Val'])

  plt.subplot(1,2,2)

  plt.plot(epoch_range, history.history['loss'])
  plt.plot(epoch_range, history.history['val_loss'])
  plt.title('Model loss')
  plt.xlabel('epoch')
  plt.ylabel('loss')
  plt.legend(['Train', 'Val'])
  plt.show()

  learning_curve(history, 50)
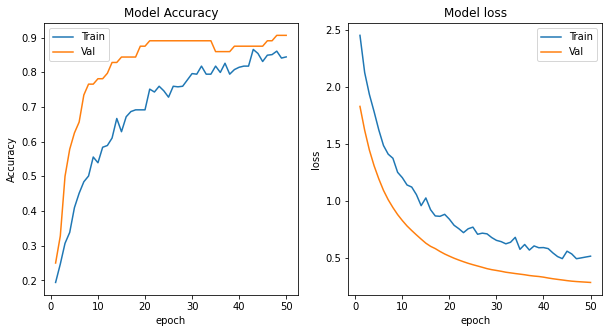
첫번째 plot은 학습할 때의 정확도와 테스트했을 때의 정확도를 비교하고,
두번째 plot은 학습할 때의 오차와 테스트했을 때의 오차를 비교한다.
그러면 다음과 같은 Learning curve가 나온다.

Model Accuracy plot을 본다.
Training set에 대한 accuracy는 epoch가 많아질수록 높아질 수 밖에 없다.
중점적으로 봐야할 부분은 Validation accuracy이다.
Validation accuracy가 급격히 높아졌으니, Underfitting이 되지는 않은 것으로 보인다.
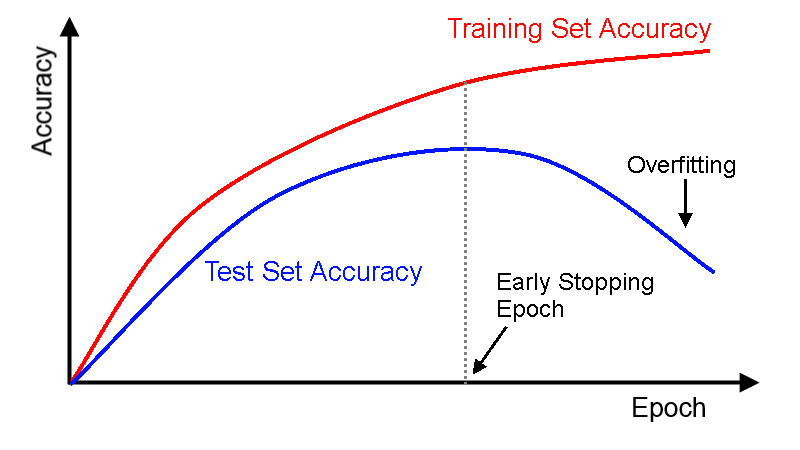
Overfitting의 경우 Validation accuracy가 점차 상승하다가 오히려 떨어져가는 모습을 보이지만,
위 plot에서는 그런 모습을 볼 수 없다.
이제 Model loss plot을 보자.
Training set에 대한 Loss는 학습을 하면 할수록 낮아질 수 밖에 없다.
역시 중점적으로 봐야할 부분은 Validation loss이다.
오차가 급격하게 떨어졌으니, 역시 Underfitting은 확실히 아닌 것으로 보인다.
곡선이 점차 완만해지고는 있지만, 역시 오차가 계속해서 감소하고 있다.
Overfitting이 됐을 경우 어느 순간부터 Validation loss가 점차 증가하는 모습을 볼 수 있다.

위의 이미지에는 Validation Set에 대한 결과 대신 Test Set에 대한 결과가 나와있다.
Overfitting이 될 경우 Learning curve에서 Accuracy에 대한 그래프는 다음과 같이 그려진다.
'Machine Learning' 카테고리의 다른 글
| Transfer Learning (0) | 2021.05.03 |
|---|---|
| Keras의 ImageDataGenerator 클래스 (0) | 2021.05.03 |
| Keras의 ModelCheckpoint (0) | 2021.04.30 |
| Keras 라이브러리를 활용해 작성한 사용자 정의 Callback 함수 (0) | 2021.04.30 |
| Classification의 문제에서 Compile에 쓰이는 Loss function의 사용 (0) | 2021.04.30 |


